Parent functions are foundational functions in mathematics, serving as the basis for understanding more complex transformations. A parent functions chart provides a visual reference for comparing graphs and properties, such as domain, range, and end behavior, enabling structured analysis of function transformations and their applications.
1.1 Definition and Importance of Parent Functions
Parent functions are basic function forms that serve as building blocks for more complex functions. They are essential for understanding function transformations, as they provide a reference point for identifying and analyzing changes. The parent functions chart organizes these foundational functions, highlighting their unique characteristics, such as domain, range, and end behavior, which are critical for solving problems and modeling real-world applications.
1;2 Overview of the Parent Functions Chart
The parent functions chart is a visual tool that categorizes and compares basic functions, such as linear, quadratic, and square root functions. It displays their graphs, equations, and key attributes like domain, range, and end behavior. This chart helps students identify patterns and understand how transformations alter graphs, making it an essential resource for analyzing and sketching functions effectively.

Types of Parent Functions
Parent functions include linear, quadratic, cubic, absolute value, piecewise, root, and rational functions, each with unique graphs and properties, forming the basis for more complex function transformations.
2.1 Linear Functions
Linear functions are represented by equations of the form f(x) = mx + b. They have straight-line graphs with a constant slope (m) and y-intercept (b). These functions are essential in modeling real-world phenomena like constant rates of change. Their graphs exhibit Odd symmetry and have a domain and range of all real numbers, making them foundational for understanding more complex function behaviors.
2.2 Nonlinear Functions (Quadratic, Cubic, etc.)
Nonlinear functions, such as quadratic (f(x) = ax² + bx + c) and cubic (f(x) = ax³ + bx² + cx + d), exhibit curved graphs. Quadratic functions form parabolas, while cubic functions have an “S” shape with one inflection point. These functions are crucial for modeling real-world phenomena like growth rates and energy consumption, differing from linear functions in their non-constant rates of change and complex graph behaviors.
2.3 Absolute Value and Piecewise Functions
Absolute value functions, like f(x) = |x|, create a V-shaped graph with a vertex at the origin, while piecewise functions combine multiple functions over specific intervals. These functions are essential for modeling real-world scenarios requiring conditional behavior, such as distance calculations or stepwise processes, and are often analyzed using parent function charts for their unique graphing and transformational properties.
2.4 Root and Rational Functions
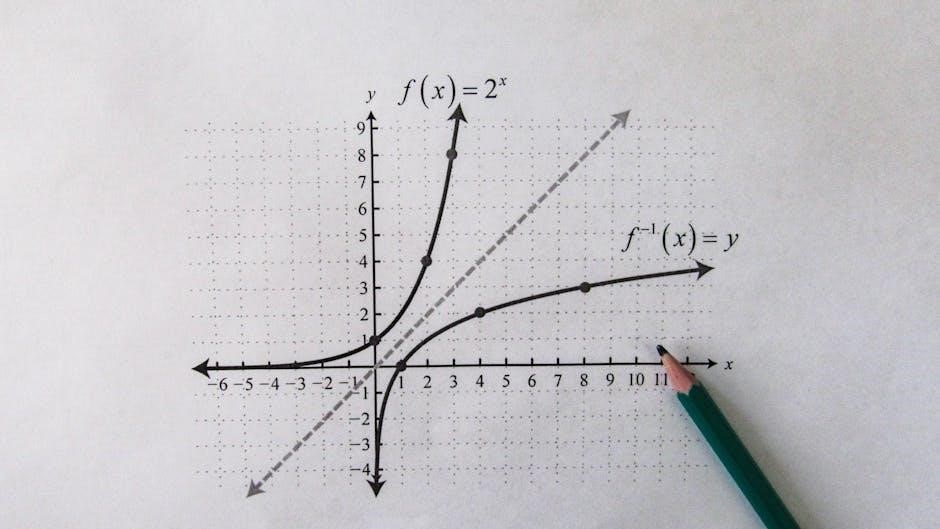
Root functions, such as f(x) = √x and f(x) = ∛x, involve radicals and have restricted domains and ranges. Rational functions, like f(x) = 1/x, are ratios of polynomials, often featuring asymptotes and points of discontinuity. The parent functions chart helps visualize these functions, highlighting their unique characteristics and behaviors, which are essential for modeling real-world phenomena and solving complex problems.

Graphical Transformations of Parent Functions
Graphical transformations include vertical shifts, horizontal shifts, stretching, compressing, and reflections. These transformations alter the parent function’s graph, enabling the analysis of how functions change in shape and position.
3.1 Vertical and Horizontal Shifts
Vertical shifts move a graph up or down by adding or subtracting a constant to the function. Horizontal shifts move the graph left or right by adding or subtracting a constant inside the function; These transformations are essential for modifying parent functions to create new functions, as shown in the parent functions chart. Examples include f(x) + c for vertical shifts and f(x ⸺ h) for horizontal shifts.
3.2 Stretching and Compressing (Scaling)
Scaling involves stretching or compressing a function vertically or horizontally. Vertical scaling multiplies the function by a constant a, stretching it if a > 1 or compressing it if 0 < a < 1. Horizontal scaling applies a factor 1/a inside the function, affecting the x-axis. This transformation alters the graph's appearance without changing its basic shape or orientation, as detailed in the parent functions chart.
3.3 Reflections Over the x-axis or y-axis
Reflections flip a function over the x-axis or y-axis. Reflecting over the x-axis multiplies the function by -1, flipping it vertically. Reflecting over the y-axis replaces x with -x, mirroring the graph horizontally. These transformations change the direction of the graph but not its basic shape or orientation, as illustrated in the parent functions chart for visual understanding and analysis.
3.4 Combining Multiple Transformations
Combining transformations involves applying multiple changes to a parent function, such as shifts, reflections, and scaling. The order of transformations matters, as vertical shifts occur before horizontal ones, and scaling can precede or follow depending on the function. The parent functions chart helps visualize these combinations, enabling clear identification of how transformations alter the graph’s appearance and behavior systematically.

Attributes of Parent Functions
Essential attributes include domain, range, end behavior, symmetry, and intervals. These properties help analyze functions, with the chart organizing traits for easy comparison and study.
4.1 Domain and Range
The domain of a function describes all possible input values (x-values), while the range describes all possible output values (y-values). Understanding these attributes is crucial for analyzing function behavior and transformations. The parent functions chart provides a clear visual representation of these attributes, making it easier to identify and compare domain and range across different functions. This helps in understanding their behavior and limitations.
4.2 End Behavior and Symmetry
End behavior describes how a function behaves as ( x ) approaches infinity or negative infinity, providing insights into its long-term trends. Symmetry refers to whether a function is odd, even, or neither, determined by its behavior around the y-axis or origin. The parent functions chart highlights these properties, aiding in the identification and comparison of function symmetry and end behavior patterns.
4.3 Increasing or Decreasing Intervals
The parent functions chart helps identify intervals where functions are increasing or decreasing. For example, linear functions have consistent behavior, while absolute value functions change direction at their vertex. Understanding these intervals is crucial for analyzing function transformations and predicting behavior, making the chart an essential tool for visualizing and comparing function growth patterns effectively.
Using the Parent Functions Chart
The parent functions chart is a visual tool for identifying basic functions and analyzing their transformations. It helps sketch graphs, understand domain/range, and predict end behavior effectively.
5.1 Identifying Basic Functions
The parent functions chart is a visual guide for identifying basic functions, such as linear, quadratic, cubic, and absolute value functions. It provides graphs, equations, and key characteristics, enabling quick recognition and comparison. By referencing the chart, users can easily identify the parent function for any transformed function, aiding in sketching and analyzing graphs effectively.
5.2 Analyzing Transformations
Using the parent functions chart, transformations can be analyzed by comparing the original function to its transformed version. Vertical shifts, horizontal shifts, stretches, compressions, and reflections can be identified by noting changes in the equation or graph. This process aids in determining the specific transformation applied to the parent function, enhancing understanding of function behavior and relationships.
5.3 Sketching Graphs
Sketching graphs using the parent functions chart involves identifying the basic function and applying transformations. Start with the parent function, then systematically apply vertical/horizontal shifts, stretches, or reflections. Key points like intercepts, vertices, and asymptotes guide the sketch. This method ensures accuracy and helps visualize how transformations alter the original graph’s shape and position, aiding in understanding function behavior.

Examples and Applications

Parent functions model real-world phenomena, such as linear growth in economics and quadratic paths in physics. Transformations solve practical problems, demonstrating the chart’s versatility in real applications.
6.1 Real-World Applications of Parent Functions
Parent functions are essential in modeling real-world scenarios. For instance, linear functions describe population growth rates, while quadratic functions model projectile motion in physics. The parent functions chart pdf provides clear visual aids to understand these applications, making complex problems more approachable. These functions are also used in economics, engineering, and environmental science to predict trends and behavior.
6.2 Solving Problems with Transformations
Understanding transformations of parent functions is crucial for solving real-world problems. By analyzing shifts, stretches, and reflections, students can model scenarios like sound waves or financial trends. The parent functions chart pdf aids in identifying these transformations, enabling learners to predict outcomes and solve complex equations systematically. This skill enhances problem-solving abilities in math and science.

Educational Resources
Utilize PDF guides and online tools like Khan Academy for detailed explanations of parent functions. SMART Technologies offers interactive resources for visual learning and practice exercises.
7.1 PDF Guides and Worksheets
PDF guides and worksheets are essential resources for mastering parent functions. They often include detailed charts, examples, and exercises to practice identifying and graphing functions. These resources are structured to cover basic concepts and complex transformations, making them ideal for self-study or classroom use. Educators and students rely on them to reinforce learning and prepare for assessments;
Many PDFs, such as those from SMART Technologies, provide interactive elements and visual aids. Worksheets focus on specific skills like domain/range identification and function analysis, offering a hands-on approach to understanding parent functions and their applications.
7.2 Online Tools and Tutorials
Online tools and tutorials offer interactive ways to explore parent functions. Websites like Khan Academy provide video lessons and exercises for understanding function transformations. Interactive graphing tools allow users to visualize changes to parent functions in real-time. These resources are ideal for self-paced learning, making complex concepts like domain, range, and symmetry more accessible and engaging for students.

Best Practices for Learning Parent Functions
Use a parent functions chart as a visual guide to compare function types. Regularly practice graphing and identifying transformations. Review common mistakes to strengthen understanding and retention of key concepts.
8.1 Structured Study Techniques
Use the parent functions chart as a visual learning tool. Create flashcards for each function type. Practice categorizing functions by their graphs and equations. Regularly review transformations and their effects. Focus on identifying patterns and relationships. Track common mistakes to avoid them. Prioritize understanding over memorization. Incorporate real-world applications to enhance retention. Schedule regular review sessions to reinforce concepts and build confidence.
8.2 Common Mistakes to Avoid
Common mistakes include confusing vertical and horizontal shifts, misidentifying domain and range restrictions, and incorrectly applying transformation scales. Students often mix up function types, such as quadratic and cubic behaviors. Additionally, neglecting to consider end behavior when analyzing transformations is a frequent error. Always double-check function characteristics and transformation rules to avoid these pitfalls and ensure accurate graphing and analysis.